
Debugging Embedded Code: Tools, Methods and Techniques
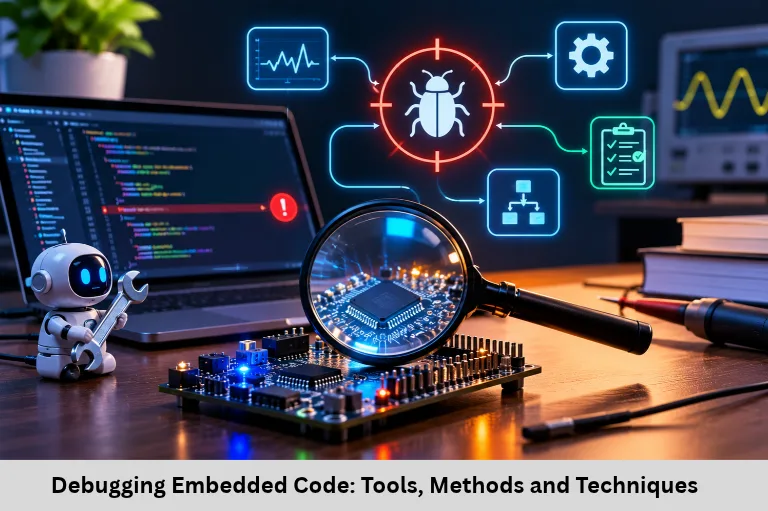
Learn embedded code debugging tools and techniques, including JTAG, SWD, oscilloscopes, UART logging, watchdog timers, and practical troubleshooting methods. Embedded Tech Development Academy (ETDA).
- Debugging Embedded Code: Tools, Methods and Techniques
-
Debugging Embedded Code: Resources, Methods, and Practical Techniques
- Introduction to Embedded Code Debugging
- Understanding the Embedded Debugging Challenges
- Essential Tools for Embedded Code Debugging
- Practical Methods for Debugging Embedded Firmware
- Practical Lessons for Reliable Debugging
- Best Practices for Consistent Debugging
- Frequently Asked Questions
- Conclusion
Debugging Embedded Code: Resources, Methods, and Practical Techniques
Introduction to Embedded Code Debugging
Debugging is an essential stage of embedded firmware development. It involves identifying, analysing, and correcting software and hardware problems that prevent an embedded device from operating as expected. Unlike desktop applications, embedded software interacts directly with physical hardware, sensors, actuators, communication interfaces, and real-time events. Therefore, debugging requires both software analysis and electrical troubleshooting.
In Embedded Systems and Internet of Things (IoT), problems may occur because of incorrect register configuration, memory corruption, interrupt conflicts, communication failures, clock settings, power fluctuations, or hardware connection issues. Some defects appear only under specific operating conditions, making them difficult to reproduce. Limited RAM, Flash memory, processing power, and debugging interfaces add further challenges.
Developers use specialised tools such as JTAG and SWD debuggers, oscilloscopes, logic analysers, UART terminals, and software simulators to identify faults. Techniques such as breakpoint analysis, watchpoints, logging, watchdog monitoring, and timing measurement help improve firmware reliability.
Embedded Tech Development Academy (ETDA) focuses on practical embedded programming and hardware-level troubleshooting. As a Top Embedded Training Institute in Bangalore, Embedded Tech Development Academy (ETDA) helps learners develop debugging skills for microcontrollers, communication protocols, and real-world Embedded Systems and Internet of Things (IoT) applications, with assured placement support for career preparation.
Understanding the Embedded Debugging Challenges
Hardware and Resource Limitations
Many microcontroller-based systems operate without a conventional operating system or standard console. Their resources may include:
Limited Flash memory and RAM.
Restricted processing speed.
No standard output or display.
Hardware-dependent program execution.
Strict real-time response requirements.
These limitations make conventional debugging methods, such as extensive printf() statements, less practical. Logging can consume memory and change execution timing, potentially hiding timing-related defects.
Interaction Between Hardware and Software
A firmware problem may actually originate from incorrect wiring, unstable power, faulty sensors, or improper signal levels. Debugging Embedded Systems and Internet of Things (IoT) therefore requires checking both the program logic and the physical circuit.
Essential Tools for Embedded Code Debugging
JTAG and SWD Debuggers
JTAG (Joint Test Action Group) and SWD (Serial Wire Debug) provide hardware-level access to supported microcontrollers. They allow developers to halt the processor, inspect program execution, and examine internal states.
Common debugging tools include ST-Link for STM32 development, SEGGER J-Link, ARM Keil ULINK, and OpenOCD.
Important debugging functions include:
Breakpoints: Stop execution at selected instructions.
Single stepping: Execute code one instruction or source line at a time.
Register inspection: Examine CPU and peripheral register values.
Memory inspection: Read RAM and Flash contents.
Watchpoints: Detect access to selected memory locations.
Oscilloscopes and Logic Analysers
An oscilloscope displays electrical signals over time, helping developers inspect voltage levels, signal transitions, noise, and timing behaviour.
Logic analysers capture digital signals and decode protocols such as UART, SPI, and I2C. They are useful for checking clock pulses, data sequences, acknowledgements, and communication timing.
Common Analysis Tools
Saleae Logic analysers for digital protocol inspection.
PulseView with sigrok-compatible hardware for open-source logic analysis.
Digital oscilloscopes for analogue and digital signal measurements.
Serial Debugging Through UART, USB, and RTT
UART logging is a common debugging method for resource-constrained microcontrollers. Firmware sends diagnostic messages to a PC terminal using a serial connection. Applications such as Tera Term and PuTTY can display these messages.
SEGGER Real-Time Transfer (RTT) provides another logging option on supported hardware. It transfers diagnostic information through the debug interface and can reduce the need for a separate serial connection.
Software Simulators and Emulators
Simulators help developers test program behaviour before running firmware on physical hardware.
Proteus: Simulates supported microcontroller circuits and electronic components.
QEMU: Emulates supported processor architectures and systems.
Renode: Supports simulation of embedded platforms and complex system configurations.
Simulation does not replace physical testing, because actual electrical behaviour and hardware-specific timing may differ.
Practical Methods for Debugging Embedded Firmware
Start with a Minimal Test
If a microcontroller fails to boot, begin with a simple program such as an LED blink or UART transmission. This helps verify basic clock configuration, power supply, GPIO operation, and processor execution before introducing complex application code.
Isolate Hardware and Software Components
Use a divide-and-test approach to identify the source of failure. Test sensors, communication buses, timers, and peripheral drivers independently. For example, test an I2C sensor using a simple register-read program before integrating it into the complete application.
Use Watchdogs and Assertions
A watchdog timer monitors system execution and can reset the microcontroller if firmware fails to refresh it within the configured interval. Assertions help detect unexpected conditions during development.
#include <assert.h>

void process_sensor(int value)
{
    assert(value >= 0);
    /* Continue with sensor processing */
}
Assertions should be configured carefully for production firmware because they may increase code size or stop normal execution when triggered.
Monitor Variables and Use Breakpoints
Inspect important variables during execution to identify unexpected values. Watchpoints are particularly useful when a variable changes unexpectedly because they can halt execution when the selected memory location is accessed.
Measure Execution Time and Performance
Use hardware timers, GPIO toggling, and profiling tools to measure task execution time. In real-time Embedded Systems, this helps identify missed deadlines, interrupt latency, and excessive processing delays.
Practical Lessons for Reliable Debugging
Check Hardware Before Blaming Firmware
A faulty pull-up resistor, loose connection, incorrect voltage level, or unstable power supply can create symptoms that appear to be software defects. Verify component values and electrical connections before changing working firmware.
Identify Race Conditions
Race conditions can occur when the main program and interrupt service routines access shared variables or resources. Use suitable critical sections, atomic operations, or RTOS mutexes where appropriate.
Pay Attention to Compiler Warnings
Warnings about incompatible data types, uninitialised variables, pointer conversions, and unused values can indicate potential defects. Enable appropriate compiler warnings and investigate them instead of ignoring them.
Test Power Failures and Brownouts
Check how firmware behaves during unexpected power interruptions and voltage drops. Validate reset behaviour, startup sequences, and recovery of stored data.
Maintain Version Control
Use Git to maintain firmware source code, configuration files, and debugging changes. Version control helps reproduce earlier defects and compare stable firmware versions with modified builds.
Best Practices for Consistent Debugging
Use standard logging levels such as INFO, WARN, and ERROR to organise diagnostic messages. Maintain a known-good firmware version for comparison and document each identified issue with its cause and solution.
Automated builds and regression tests can help detect defects after code changes. Where practical, integrate firmware testing into a continuous integration and continuous delivery (CI/CD) workflow. These practices improve development consistency for complex Embedded Systems and Internet of Things (IoT) products.
Embedded Tech Development Academy (ETDA) encourages practical understanding of microcontroller debugging, firmware testing, and peripheral-level troubleshooting. As a Top Embedded Training Institute in Bangalore, Embedded Tech Development Academy (ETDA) helps learners strengthen technical knowledge through embedded development concepts and offers assured placement support for career preparation.
Frequently Asked Questions
What is debugging in embedded systems?
Debugging is the process of identifying and correcting software and hardware faults that prevent an embedded device from operating correctly.
What are JTAG and SWD used for?
JTAG and SWD provide hardware debugging access to supported microcontrollers, allowing developers to set breakpoints, inspect registers, and examine memory.
Why are logic analysers used in embedded debugging?
Logic analysers capture digital signals and help decode communication protocols such as UART, SPI, and I2C to identify timing and data-transfer problems.
What is the purpose of a watchdog timer?
A watchdog timer detects certain firmware execution failures, such as a system hang, and can reset the microcontroller if it is not refreshed within the configured period.
How does UART help in debugging embedded code?
UART allows firmware to transmit diagnostic messages to a computer terminal, helping developers monitor program execution, variable values, and error conditions.
Why is hardware testing important during firmware debugging?
Embedded firmware directly interacts with physical components. Incorrect wiring, unstable power, faulty sensors, and signal-level problems can produce symptoms that appear to be software errors.
Conclusion
Debugging embedded code requires a systematic approach that combines software analysis, hardware measurement, and real-time performance testing. Tools such as JTAG and SWD debuggers, oscilloscopes, logic analysers, UART terminals, and simulators help developers identify faults at different levels of an embedded product.
Starting with minimal tests, isolating peripherals, monitoring variables, checking electrical signals, and analysing timing behaviour can significantly reduce troubleshooting time. Compiler warnings, watchdog timers, assertions, version control, and automated regression testing also contribute to reliable firmware development.
These techniques are essential for building dependable Embedded Systems and Internet of Things (IoT) products used in automotive electronics, industrial automation, smart devices, and connected equipment. Embedded Tech Development Academy (ETDA) focuses on developing practical knowledge of Embedded C, microcontroller programming, hardware interfacing, and debugging techniques. As a Top Embedded Training Institute in Bangalore, Embedded Tech Development Academy (ETDA) supports learners in developing industry-oriented embedded engineering skills, along with assured placement support to assist with career preparation.
Author: ETDA Trainers
Experience: 10+ Years of Industry Experience in Embedded Systems, IoT, and Embedded C Programming