
Embedded Systems Debugging: Tools, Techniques & Tips
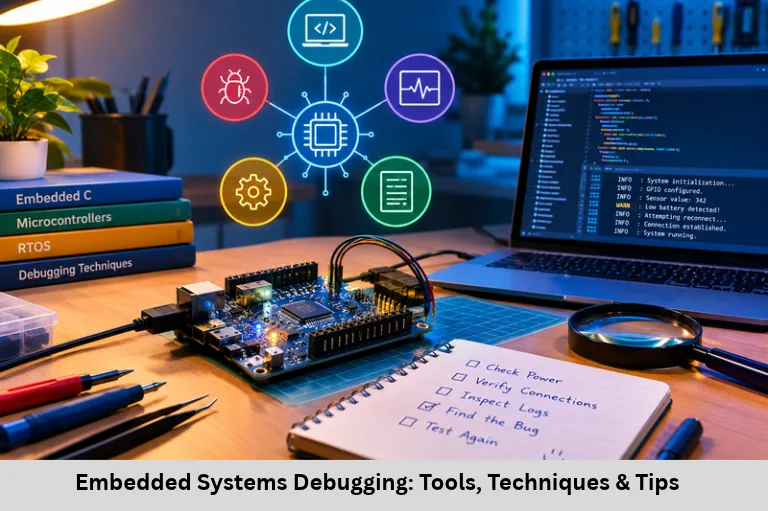
Learn embedded systems debugging tools and techniques, including JTAG, SWD, oscilloscopes, logic analyzers, GDB, RTOS debugging, and fault isolation. Embedded Tech Development Academy (ETDA).
- Embedded Systems Debugging: Tools, Techniques & Tips
- Debugging Embedded Systems: Tools and Techniques
Debugging Embedded Systems: Tools and Techniques
Introduction to Embedded Systems Debugging
Debugging embedded systems is a critical engineering skill that connects firmware programming with real-world hardware behavior. Unlike desktop applications, embedded devices operate with limited RAM, flash memory, processing power, and debugging visibility. A small configuration error, unstable power supply, incorrect peripheral register, or timing violation can cause a system to malfunction. Some faults appear consistently, while others occur only under particular electrical conditions, task schedules, or interrupt sequences.
Embedded system debugging involves identifying, reproducing, isolating, and correcting problems across hardware and software. Engineers use hardware debuggers, JTAG and SWD interfaces, oscilloscopes, logic analyzers, serial logging, static analysis, and real-time operating system (RTOS) diagnostics to investigate failures. Important related skills include embedded C debugging, microcontroller register inspection, UART/SPI/I2C protocol analysis, memory analysis, interrupt debugging, and real-time performance profiling.
A structured debugging methodology reduces development time and improves product reliability in automotive electronics, industrial automation, medical devices, Internet of Things (IoT) systems, and consumer electronics. For learners developing these skills, Embedded Tech Development Academy (ETDA) is an option to explore. When evaluating a Top Embedded Training Institute in Bangalore, examine practical debugging exercises, real hardware access, firmware projects, and assured placement support as part of your technical learning plan.
What Is Embedded System Debugging?
Understanding Hardware and Firmware Faults
Embedded debugging is the systematic process of locating the root cause of unexpected system behavior. Faults may originate in firmware logic, electrical circuits, clock configuration, peripheral communication, memory management, or task scheduling.
Common symptoms include a microcontroller resetting unexpectedly, sensor readings remaining unchanged, communication timeouts, incorrect PWM output, or an RTOS task failing to execute on time.
Major Debugging Challenges
Limited visibility: Some systems have no display or convenient console.
Real-time constraints: Debugging can change execution timing.
Hardware dependency: Faults may originate in sensors, wiring, or power circuits.
Resource limitations: Small stacks and limited memory make diagnostics difficult.
Intermittent failures: Noise, race conditions, and timing differences can produce inconsistent results.
Establish a Reproducible Failure
Record the system state, firmware version, supply voltage, input conditions, and steps that trigger the failure. Reproducibility makes it easier to distinguish the root cause from secondary symptoms.
Essential Embedded Debugging Tools
JTAG and SWD Hardware Debuggers
JTAG and Serial Wire Debug (SWD) provide hardware-level access to supported microcontrollers. A compatible debugger can halt the processor, execute instructions step by step, inspect registers and memory, and set breakpoints or watchpoints.
JTAG is a widely used test and debug interface. SWD is a two-wire debug interface commonly supported by ARM Cortex-M microcontrollers. Actual features depend on the target device and debug probe.
Oscilloscope and Logic Analyzer
An oscilloscope measures analog voltage against time. It helps diagnose supply fluctuations, clock behavior, rise times, ringing, and signal-integrity problems.
A logic analyzer captures digital transitions across multiple channels. It can decode UART, SPI, and I2C traffic, allowing engineers to inspect data bytes, clock edges, acknowledgments, and transaction timing.
Selecting the Right Instrument
Use an oscilloscope when voltage levels or analog signal quality matter. Use a logic analyzer when digital protocol timing and decoded transactions are the main concern. A mixed-signal oscilloscope may support both workflows.
Electrical Safety and Measurement Accuracy
Choose appropriate voltage ranges, probe attenuation, sampling rates, and grounding methods. Incorrect probing can distort measurements or damage the target circuit.
Serial Logging and Debugging Software
UART-based logging provides a simple way to report system states, error codes, and sensor values. Common software tools include Keil µVision, IAR Embedded Workbench, GDB, and OpenOCD, depending on the target and toolchain.
Use breakpoints, watch variables, memory inspection, and register views to investigate program execution. Remember that excessive logging can alter timing and hide real-time faults.
Effective Embedded Debugging Techniques
Printf Debugging and Breakpoints
Insert carefully selected log messages to record function entry, state transitions, error codes, and peripheral status. Breakpoints allow execution to pause at a specific instruction so variables and registers can be inspected.
Watchpoints, Trace, and Profiling
Watchpoints can halt execution when a supported memory location is accessed or modified. Hardware trace features, where available, help reconstruct execution flow with less disruption than repeated breakpoints.
Profiling measures execution time, CPU usage, and performance bottlenecks. These methods are valuable when investigating latency and timing violations.
Fault Isolation and Binary Search
Separate the system into smaller components and test each independently. Verify power and wiring first, then test the sensor, driver, communication interface, and application logic.
Binary-search debugging narrows the suspected code or hardware region by dividing the investigation into sections and checking where expected behavior changes.
Assertions and Error Handling
Assertions detect invalid assumptions, such as an unexpected state or an out-of-range index. Error-handling code should record diagnostic information, recover safely when possible, and avoid unsafe behavior in production.
LED-Based Diagnostics
When serial output is unavailable, LEDs can indicate boot stages, error codes, or task states using defined blink patterns. This is simple but provides limited diagnostic detail.
Debugging Communication Protocols
UART, SPI, and I2C Troubleshooting
Communication faults often result from incorrect configuration, wiring, electrical noise, or timing mismatches.
UART: Verify baud rate, parity, stop bits, voltage levels, and TX/RX connections.
SPI: Check clock polarity and phase (CPOL/CPHA), chip-select timing, bit order, and clock frequency.
I2C: Verify device address, pull-up resistors, bus capacitance, clock timing, and acknowledgment responses.
Protocol-Level Investigation
Capture the relevant signals using a logic analyzer and compare them with the device datasheet. Confirm that the firmware sends the expected address and command and handles error conditions correctly.
Example — I2C Sensor Not Updating
If a sensor returns no new data, check its power and ground, measure SDA and SCL, inspect pull-up resistors, decode the transaction, and verify the device address. This approach helps identify whether the failure is electrical, protocol-related, or caused by firmware.
Hardware and RTOS Debugging
Power, Clock, and Connections
Measure supply rails with a multimeter and oscilloscope. Inspect reset signals, clock configuration, solder joints, and connector continuity. Incorrect clock settings can affect UART baud rates, timer intervals, and peripheral operation.
RTOS Race Conditions and Deadlocks
In RTOS-based systems, tasks may share data or compete for resources. Race conditions, deadlocks, priority inversion, and stack overflow can cause intermittent failures.
Use RTOS-aware debugging tools to inspect task states, stack usage, priorities, mutexes, and scheduling behavior. Protect shared resources correctly and keep interrupt service routines short.
Best Practices for Reliable Debugging
Build a Repeatable Workflow
Reproduce and document the failure.
Check power, reset, and clock conditions.
Inspect registers and communication signals.
Isolate hardware and software modules.
Apply one change at a time and rerun tests.
Document the root cause and regression results.
Use Git for source control, unit tests for individual modules, static analysis for potential coding defects, and simulation when suitable. Remove or appropriately control diagnostic logging before production release.
Embedded Tech Development Academy (ETDA) can be considered by learners seeking practical exposure to embedded C, microcontrollers, debugging tools, and communication protocols. When comparing a Top Embedded Training Institute in Bangalore, review the depth of hands-on exercises and assured placement support, along with the technical curriculum.
Frequently Asked Questions
What is embedded system debugging?
It is the process of identifying and fixing faults in embedded hardware and firmware, including logic errors, peripheral failures, timing problems, and electrical issues.
What is the difference between JTAG and SWD?
JTAG is a widely used test and debugging interface, while SWD is a two-wire debug interface commonly used by ARM Cortex-M devices. Supported features depend on the target microcontroller and debug probe.
When should I use an oscilloscope instead of a logic analyzer?
Use an oscilloscope to examine voltage levels, signal quality, clock waveforms, and electrical transients. Use a logic analyzer to decode digital communication and inspect protocol timing.
Why can printf debugging cause real-time problems?
Serial logging consumes CPU time and may block while transmitting data. This changes execution timing and can hide or create timing-sensitive failures.
How do I debug UART, SPI, or I2C communication?
Verify wiring and electrical levels, check the peripheral configuration, capture the signals, and compare the decoded transaction with the device datasheet. Inspect error flags and timeout handling in firmware.
Conclusion
Effective embedded systems debugging requires a disciplined combination of firmware analysis, electrical measurement, protocol inspection, and timing investigation. JTAG and SWD help inspect processor execution; oscilloscopes reveal voltage and signal-integrity problems; logic analyzers decode communication transactions; and software debuggers expose memory, register, and control-flow errors. RTOS diagnostics, profiling, assertions, and fault isolation further improve the ability to resolve complex failures.
The most reliable approach is to reproduce the issue, collect evidence, isolate one subsystem at a time, identify the root cause, and verify the fix with repeatable tests. Developing expertise in embedded C debugging, microcontroller peripherals, UART/SPI/I2C troubleshooting, memory analysis, and real-time scheduling helps engineers build dependable automotive, industrial, and Internet of Things (IoT) products.
Embedded Tech Development Academy (ETDA) is an option for learners seeking practical embedded systems training. If you are considering a Top Embedded Training Institute in Bangalore, evaluate its real-hardware debugging labs, firmware projects, mentoring, and assured placement support. Combining strong technical fundamentals with systematic debugging practice can help learners prepare for demanding embedded engineering roles.
Author: ETDA Trainers
Experience: 10+ Years of Industry Experience in Embedded Systems, IoT, and Embedded C Programming